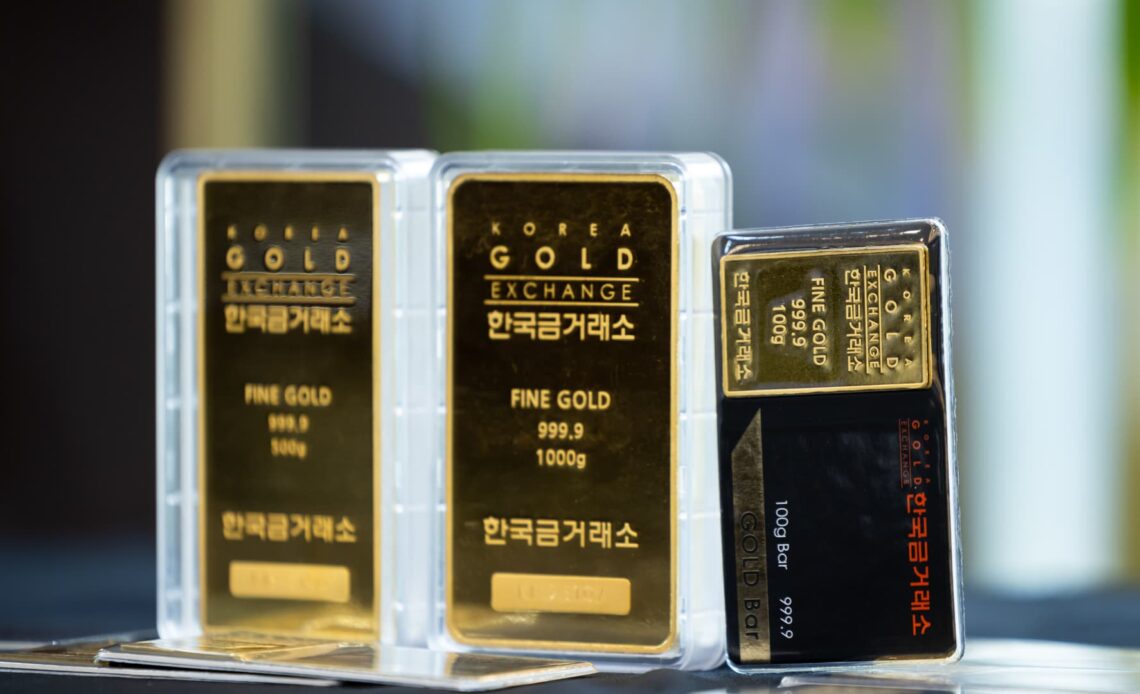
With investors focused in on the major equity averages achieving new milestones this week , it may be surprising to learn that gold has actually performed both the S & P 500 and Nasdaq so far in 2024. Let’s take a look at how gold stocks have fared and see how recent price action suggests the uptrend is nowhere near completed. While gold began 2024 by underperforming equities, a resurgence in March and early April propelled this commodity much higher. In fact, from the end of 2023, SPDR Gold Shares (GLD) are up about 15%, compared to the S & P 500’s 12% gain and the Nasdaq 100’s 11% move higher. While gold stocks tend to be very much tied to the performance of the underlying commodity, there will often be periods of dislocation, where gold and gold miners appear to be more disconnected. This appears to have occurred in the first quarter, when physical gold was fairly flat, but gold miners were sold off into a February low. But as we can see in the chart of the VanEck Vectors Gold Miners ETF (GDX) , the two charts have returned to a more positive correlation: After retesting the October 2023 low around $26, the GDX is now testing its spring 2023 high around $36. That’s about a 40% gain off the February 2024 low, compared to the S & P 500’s 8% rally over that same time frame. The most encouraging part of this chart is that if the GDX were to break above the $36 level, which we see as a likely scenario, that would imply a likely retest of the 2022 high around $41. That would represent another 15% gain beyond current levels. ‘Influx of buying power’ For the GDX to complete a breakout above resistance, you would need to see individual gold stocks breaking out as well. The chart of Royal Gold (RGLD) shows that the early breakouts are beginning to occur. I tend to think of support and resistance levels as “ranges” as opposed to specific price levels. On the chart of RGLD, the green-shaded area is around $122 to $123, which first served as price resistance in July 2023. Notice how many times this resistance range has been tested, including a number of times in Q4 2023 and then most of the month of April 2024. The more that a level of resistance of tested, the more meaningful the breakout when the price actually pushes above that level of resistance. So as RGLD has powered above $123 this month, that represents a “change of character” on the chart, suggesting an influx of buying power. Now that RGLD has cleared this resistance range, I see upside potential to…
Click Here to Read the Full Original Article at Investing…


